
Reading Sensor Data from an Arduino Microcontroller with Python
Accessing a microcontroller via a serial port


While we often think of Python in the context of machine learning or data analysis, we can also use it for interacting with embedded systems. In this article I will show how to use Python to interact with a temperature and humidity sensor plugged into an Arduino microcontroller, which is similar to a Raspberry Pi. It is fairly inexpensive to buy the parts you would need to duplicate what I have done here, and it is a good starting point for familiarizing yourself with writing this kind of software.
To reproduce what will be discussed here you will need the following:
Mega 2560 R3 Microcontroller Board: https://store-usa.arduino.cc/products/arduino-mega-2560-rev3
4-pin connector to breadboard pin cables: https://store-usa.arduino.cc/products/grove-4-pin-male-to-grove-4-pin-cable-5-pcs
temperature and humidity sensor: https://wiki.seeedstudio.com/Grove-Temperature_and_Humidity_Sensor_Pro/
Arduino software IDE: https://www.arduino.cc/en/software/
USB cable with a USB-B end to power and communicate with the Arduino Mega 2560 R3 microcontroller
In addition you should make sure you have Python 3.12 or later installed on your computer.
The Github repository containing all the code for this project is located at:
The software we will discuss here presumes that the Arduino hardware is configured as shown here:
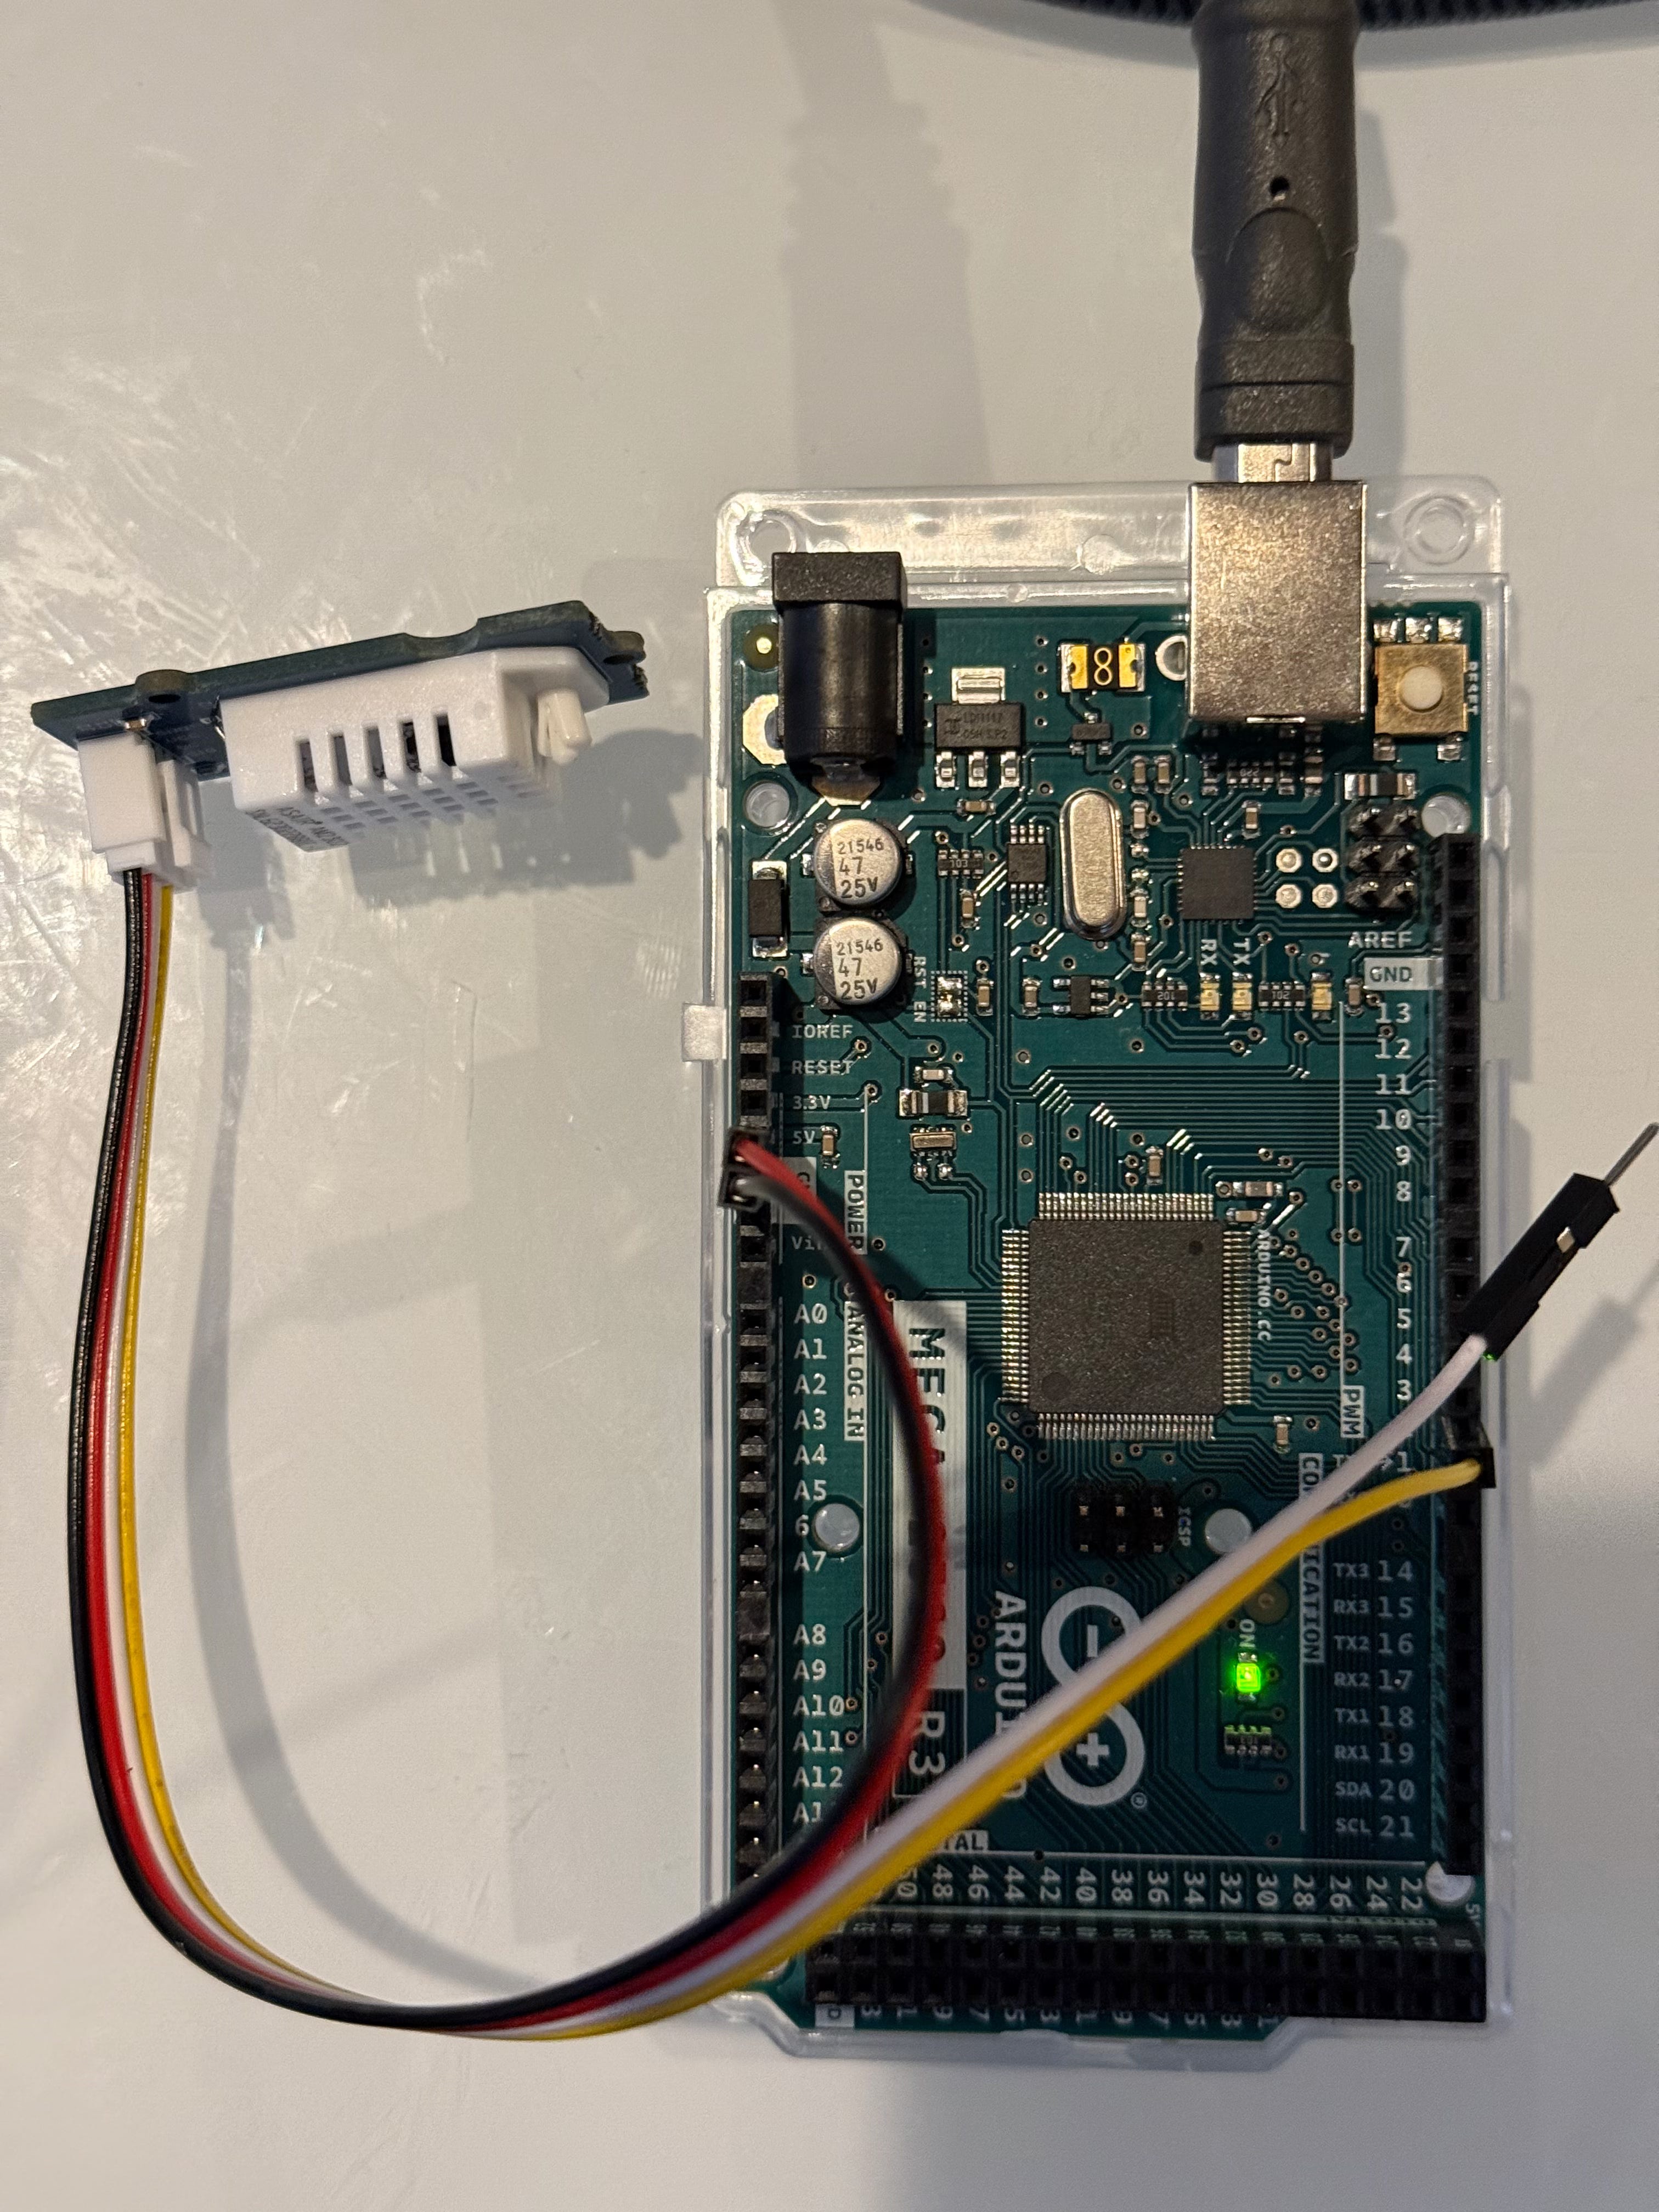
Here the USB cable is plugged into my laptop and the USB-B (box-like) end is plugged into the Arduino Mega 2560 R3 microcontroller which not only provides communication between it and the laptop but also power. As you can see, the cable has a 4-pin connector that is plugged into the socket on the small satellite sensor board and 3 of its 4 pins are plugged into breadboard-style sockets on the Mega microcontroller board. The black and red wires are plugged into the sockets labeled POWER as you can see above, and the yellow wire is the data wire. The data wire can be plugged into any DATA pin, for this example I choose to plug it into data pin 2 (D2).
When the Arduino Mega 2560 R3 microcontroller is connected to your computer via the USB cable, you can launch the Arduino IDE to see the device name of the USB port the computer is using to communicate with it (circled in red below):
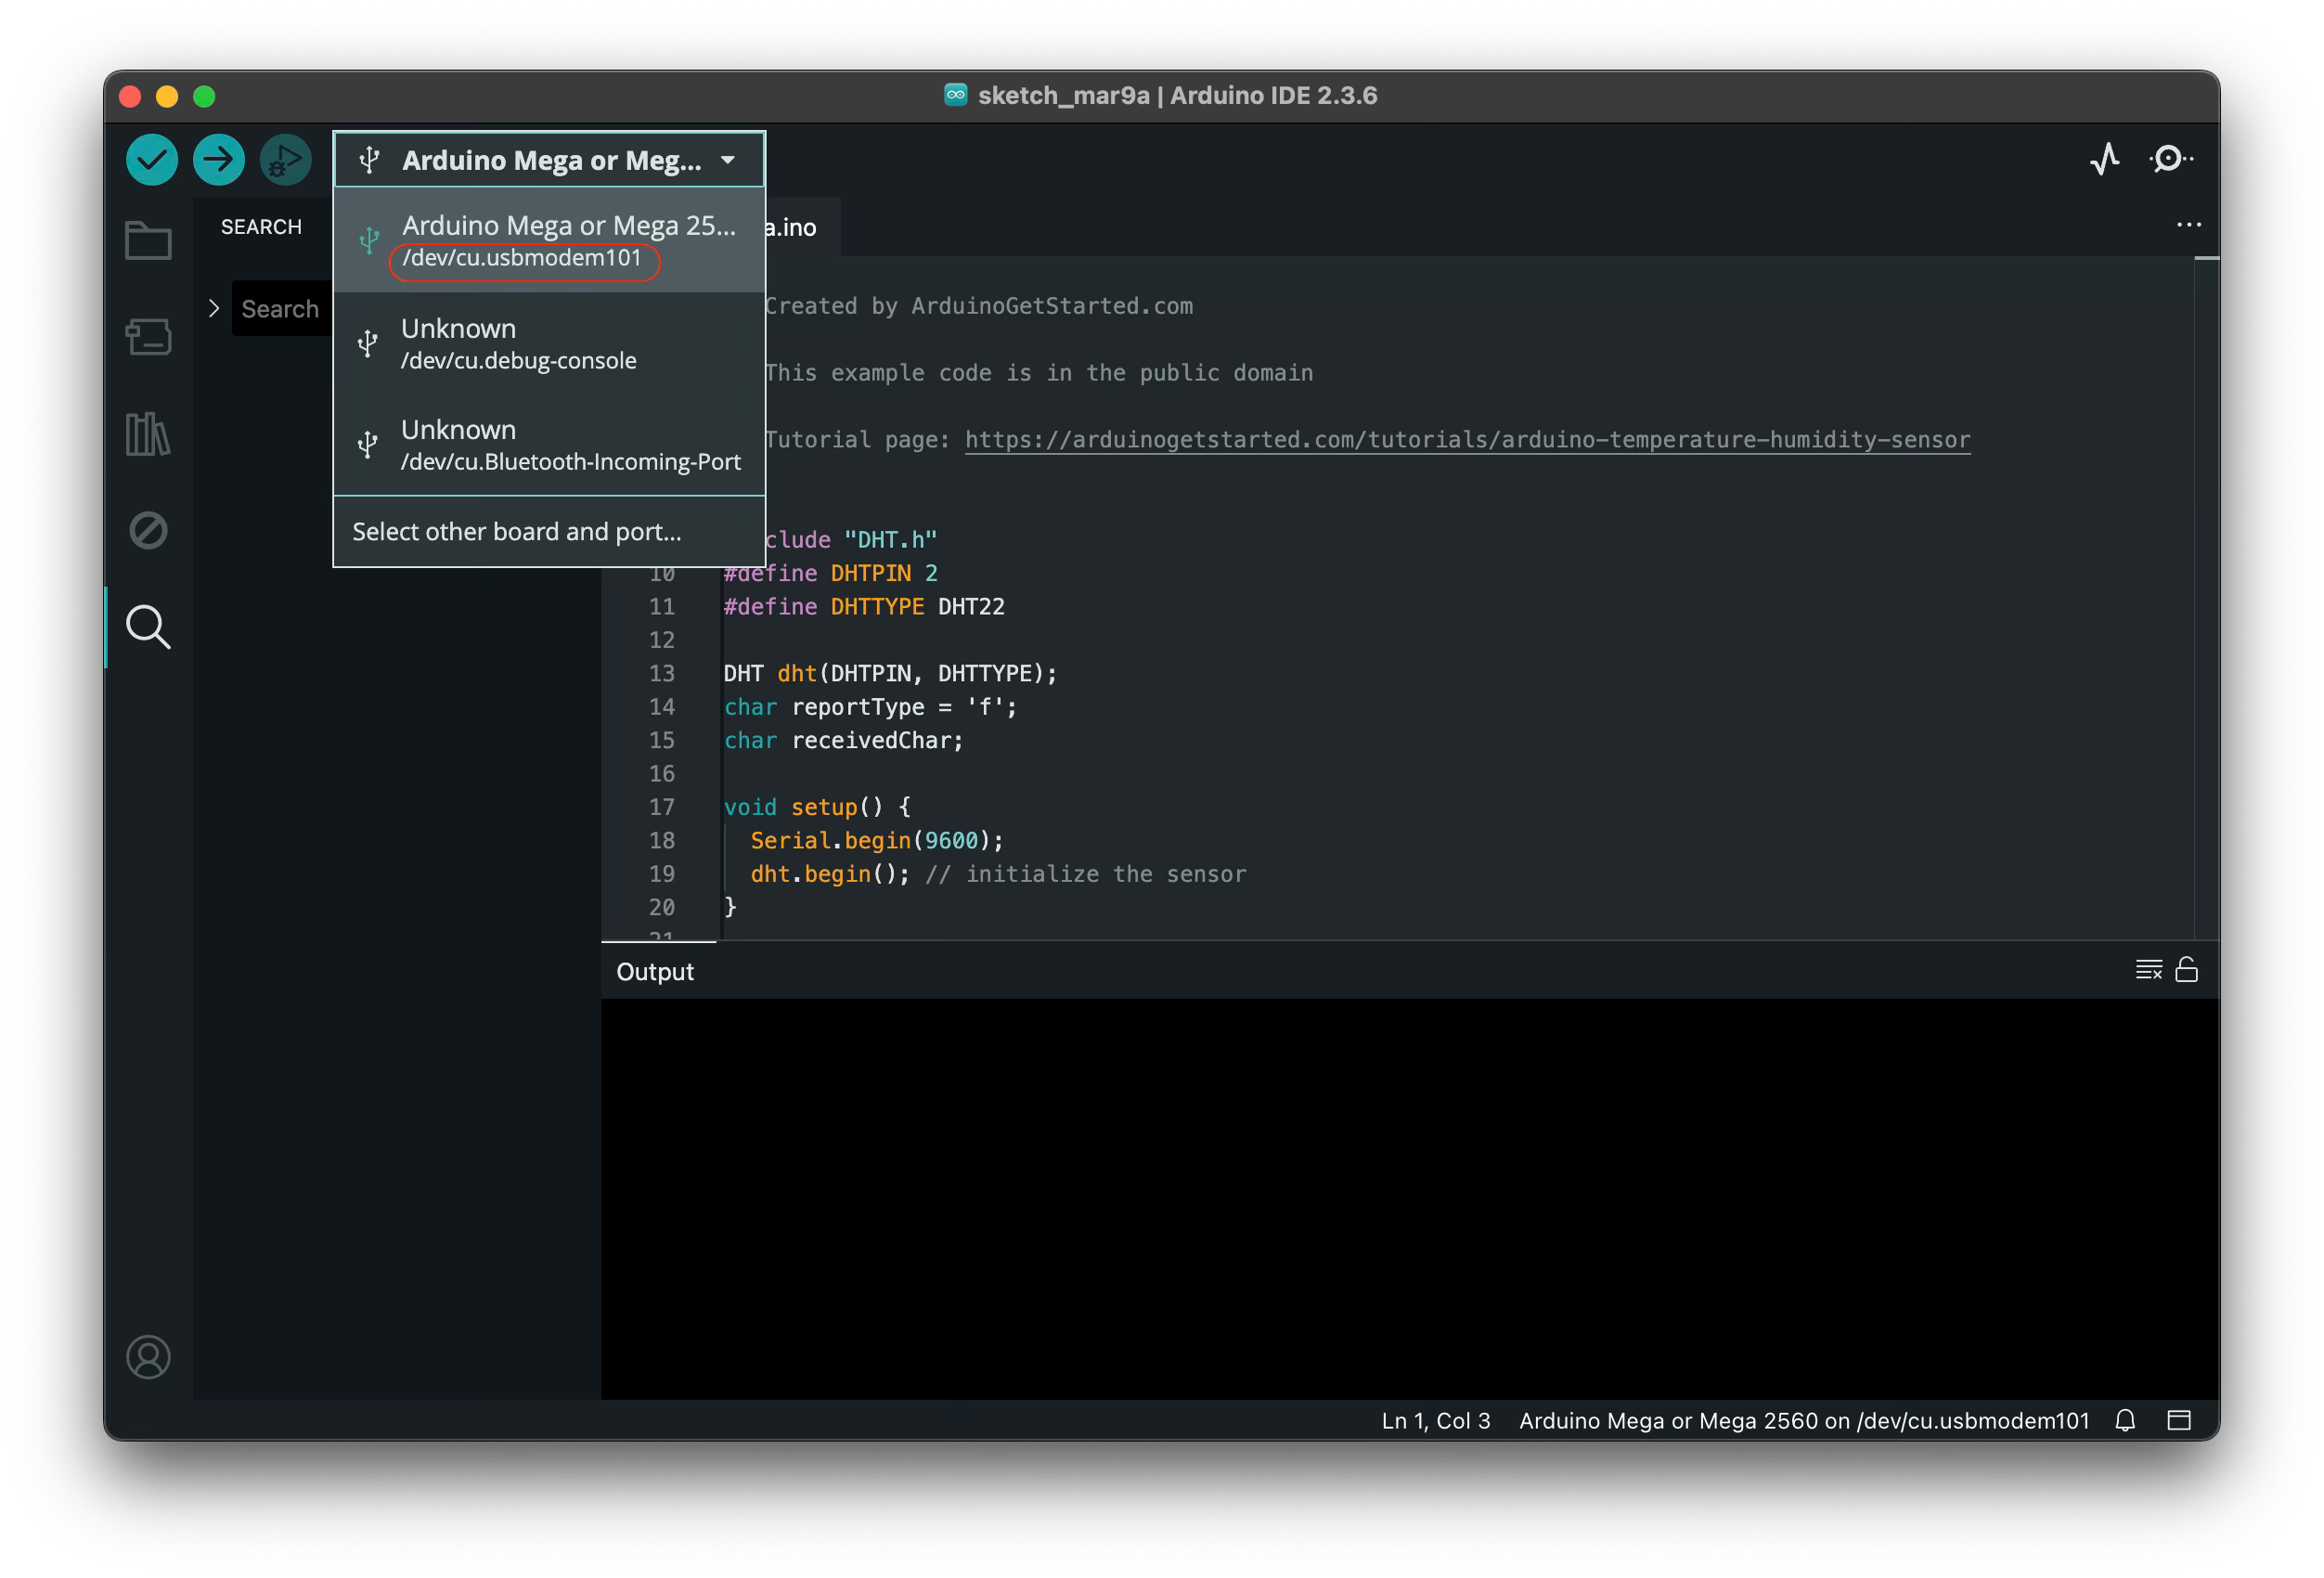
You should keep this port name handy as the Python code will need it as an input argument when you run it.
The Arduino microcontroller is programmed in a language called Arduino which is very similar to C++, it includes a few additional features that make it easier to use for this kind of programming than plain GNU C++. Arduino program files have extension .ino and are referred to as “sketches.” The Arduino IDE includes a “sketchbook” which is like a collection of your Arduino programs. For this example we have modified one of the Arduino demonstration programs that you can see at https://arduinogetstarted.com/tutorials/arduino-temperature-humidity-sensor . Our modified program (or sketch) is like this:
/*
 * Created by ArduinoGetStarted.com
 *
 * This example code is in the public domain
 *
 * Tutorial page: https://arduinogetstarted.com/tutorials/arduino-temperature-humidity-sensor
 *
 * Modified by M. Card April 2025
 */

#include "DHT.h"
#define DHTPIN 2
#define DHTTYPE DHT22

DHT dht(DHTPIN, DHTTYPE);
char reportType = 'f';
char receivedChar;

void setup() {
  Serial.begin(9600);
  dht.begin(); // initialize the sensor
}

void loop() {

  // Check desired report type, f = temp in Fahrenheit, c = Celsius
  if (Serial.available() > 0) {
    receivedChar = Serial.read();

    if (receivedChar ==  'f' || receivedChar == 'F') {
      reportType = 'f';
    } else if (receivedChar ==  'c' || receivedChar == 'C') {
      reportType = 'c';
    } else {
      reportType = '\0';
    }
  }

  // wait 1000 milliseconds between measurements.
  delay(1000);

  // read humidity
  float humi  = dht.readHumidity();

  // check if any reads failed
  if (isnan(humi)) {
    Serial.println("Failed to read from DHT sensor!");
  } else {
    Serial.print("{");
    Serial.print("\"humidity\": ");
    Serial.print(humi);
    if (reportType == 'c') {
      // read temperature as Celsius
      float tempC = dht.readTemperature();
      Serial.print(", ");
      Serial.print("\"temp_c\": ");
      Serial.print(tempC);
      Serial.println("}");
    } else if (reportType == 'f') {
      // read temperature as Fahrenheit
      float tempF = dht.readTemperature(true);
      Serial.print(", ");
      Serial.print("\"temp_f\": ");
      Serial.print(tempF);
      Serial.println("}");
    } else {
      Serial.println("}");
    }
  }
}
Note here that this code sets the DHTPIN constant to 2, indicating that the data pin to use for the serial data port is port 2 on the Arduino Mega 2560 Rev3 microcontroller board. If you decide to use a different port for the yellow wire you should change this constant to match. Also this code sets the serial port speed to 9600 baud, and you can experiment with different values for this. This code differs from the original sketch in that it reads commands from the serial port as well as writing data to it. If a “c” is received the temperature is reported in degrees Celsius, and if an “f” is received it reports the temperature in degrees Fahrenheit. The data from this sketch is made available on the output port as a JSON string for convenience as opposed to a non-JSON string that would require custom parsing as is done in the original sketch.
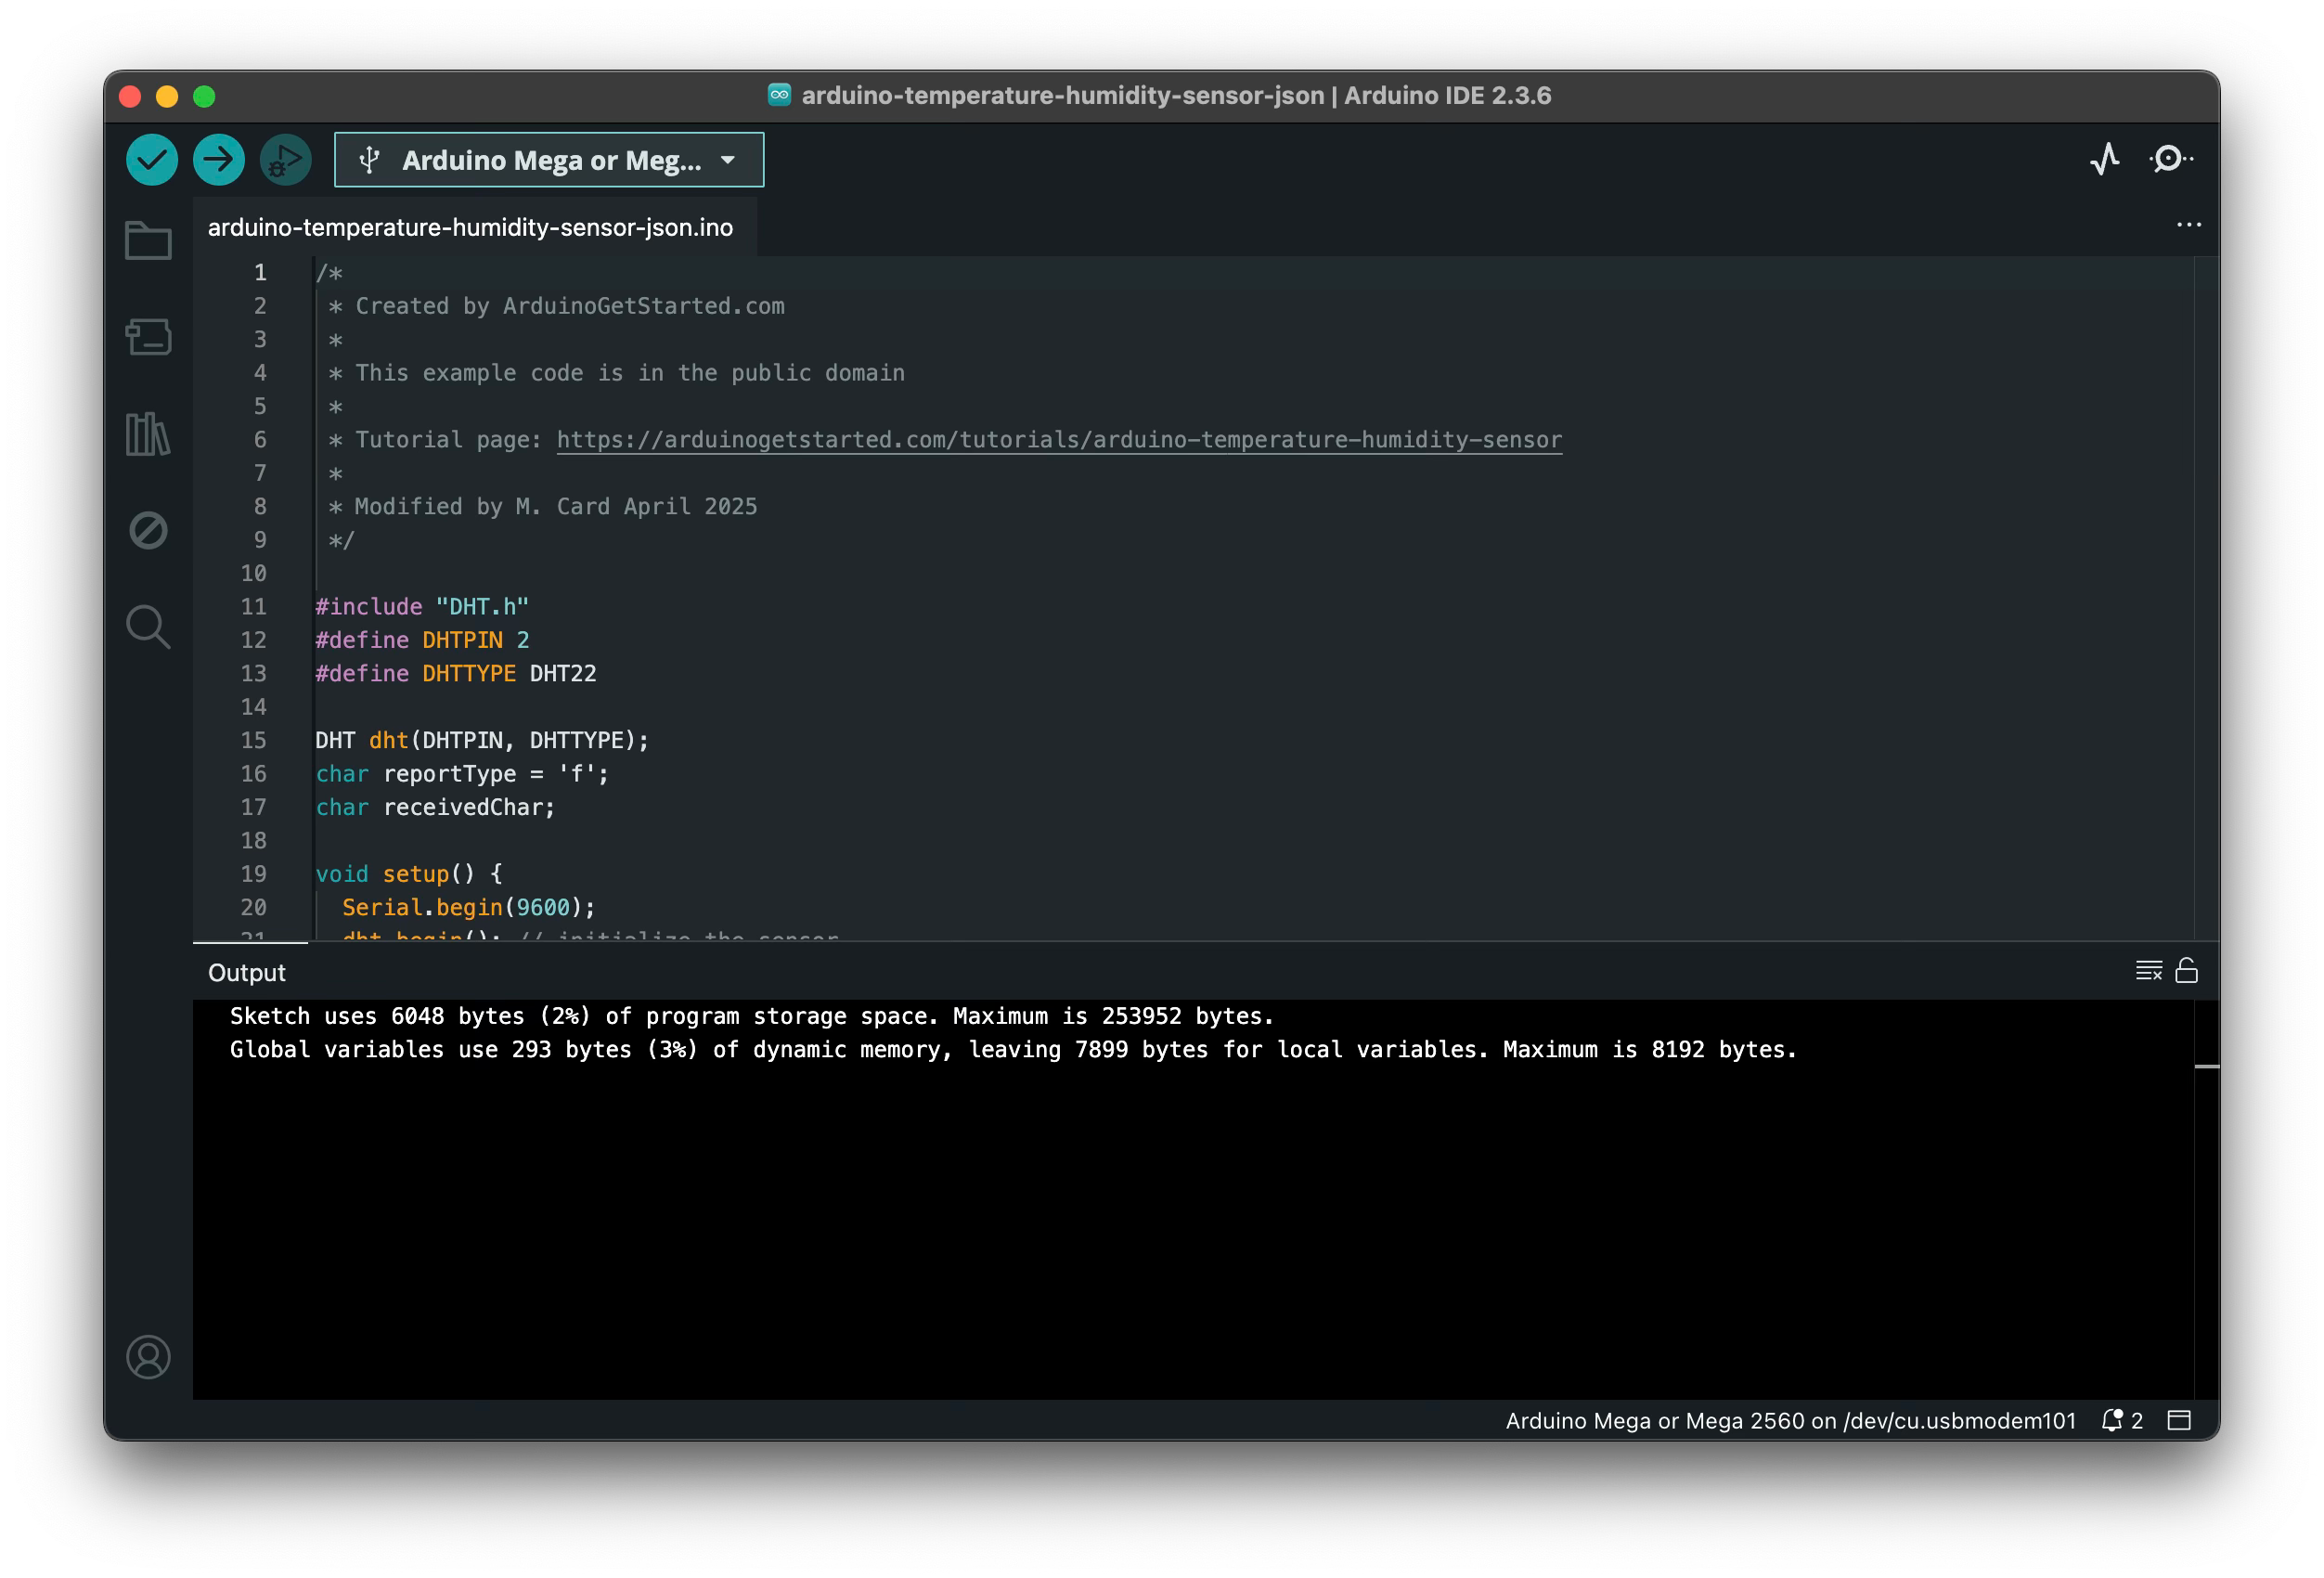
To upload and run the above program on in the Arduino IDE, you would open the repository’s sketches/arduino-temperature-humidity-sensor-json.ino file and click the right-arrow symbol in the upper left corner of the IDE window. When you do the IDE should display something like this:
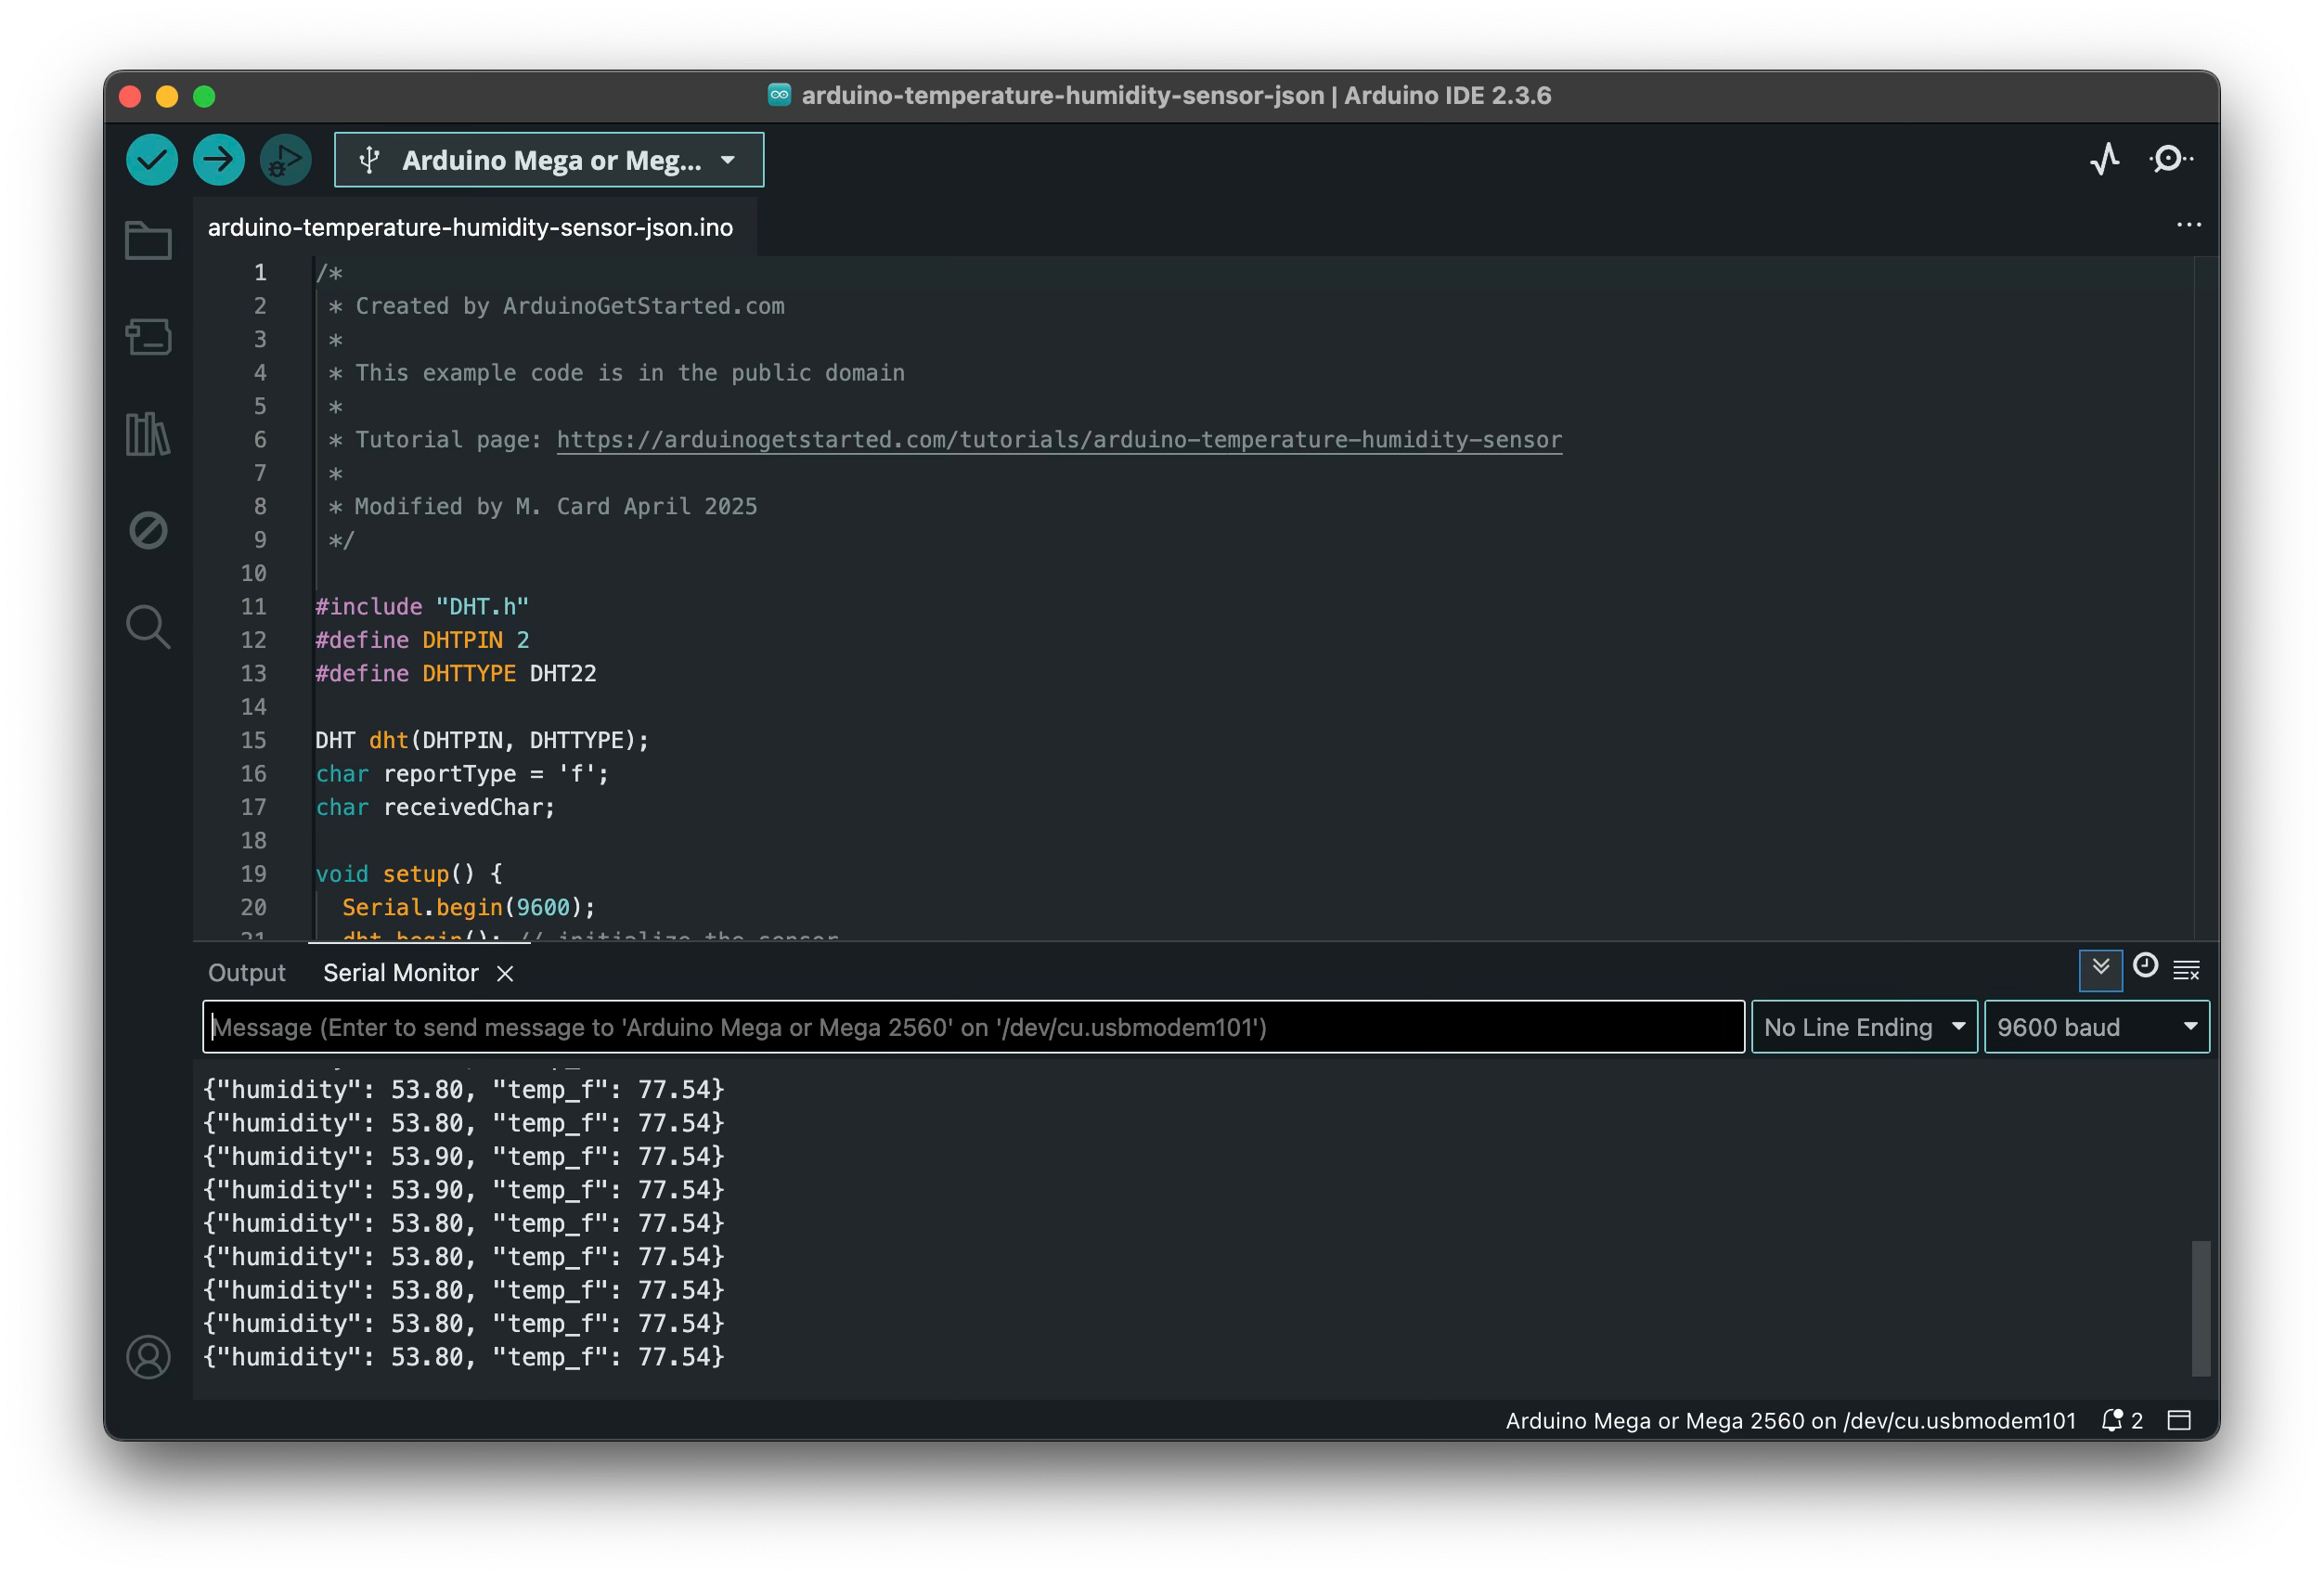
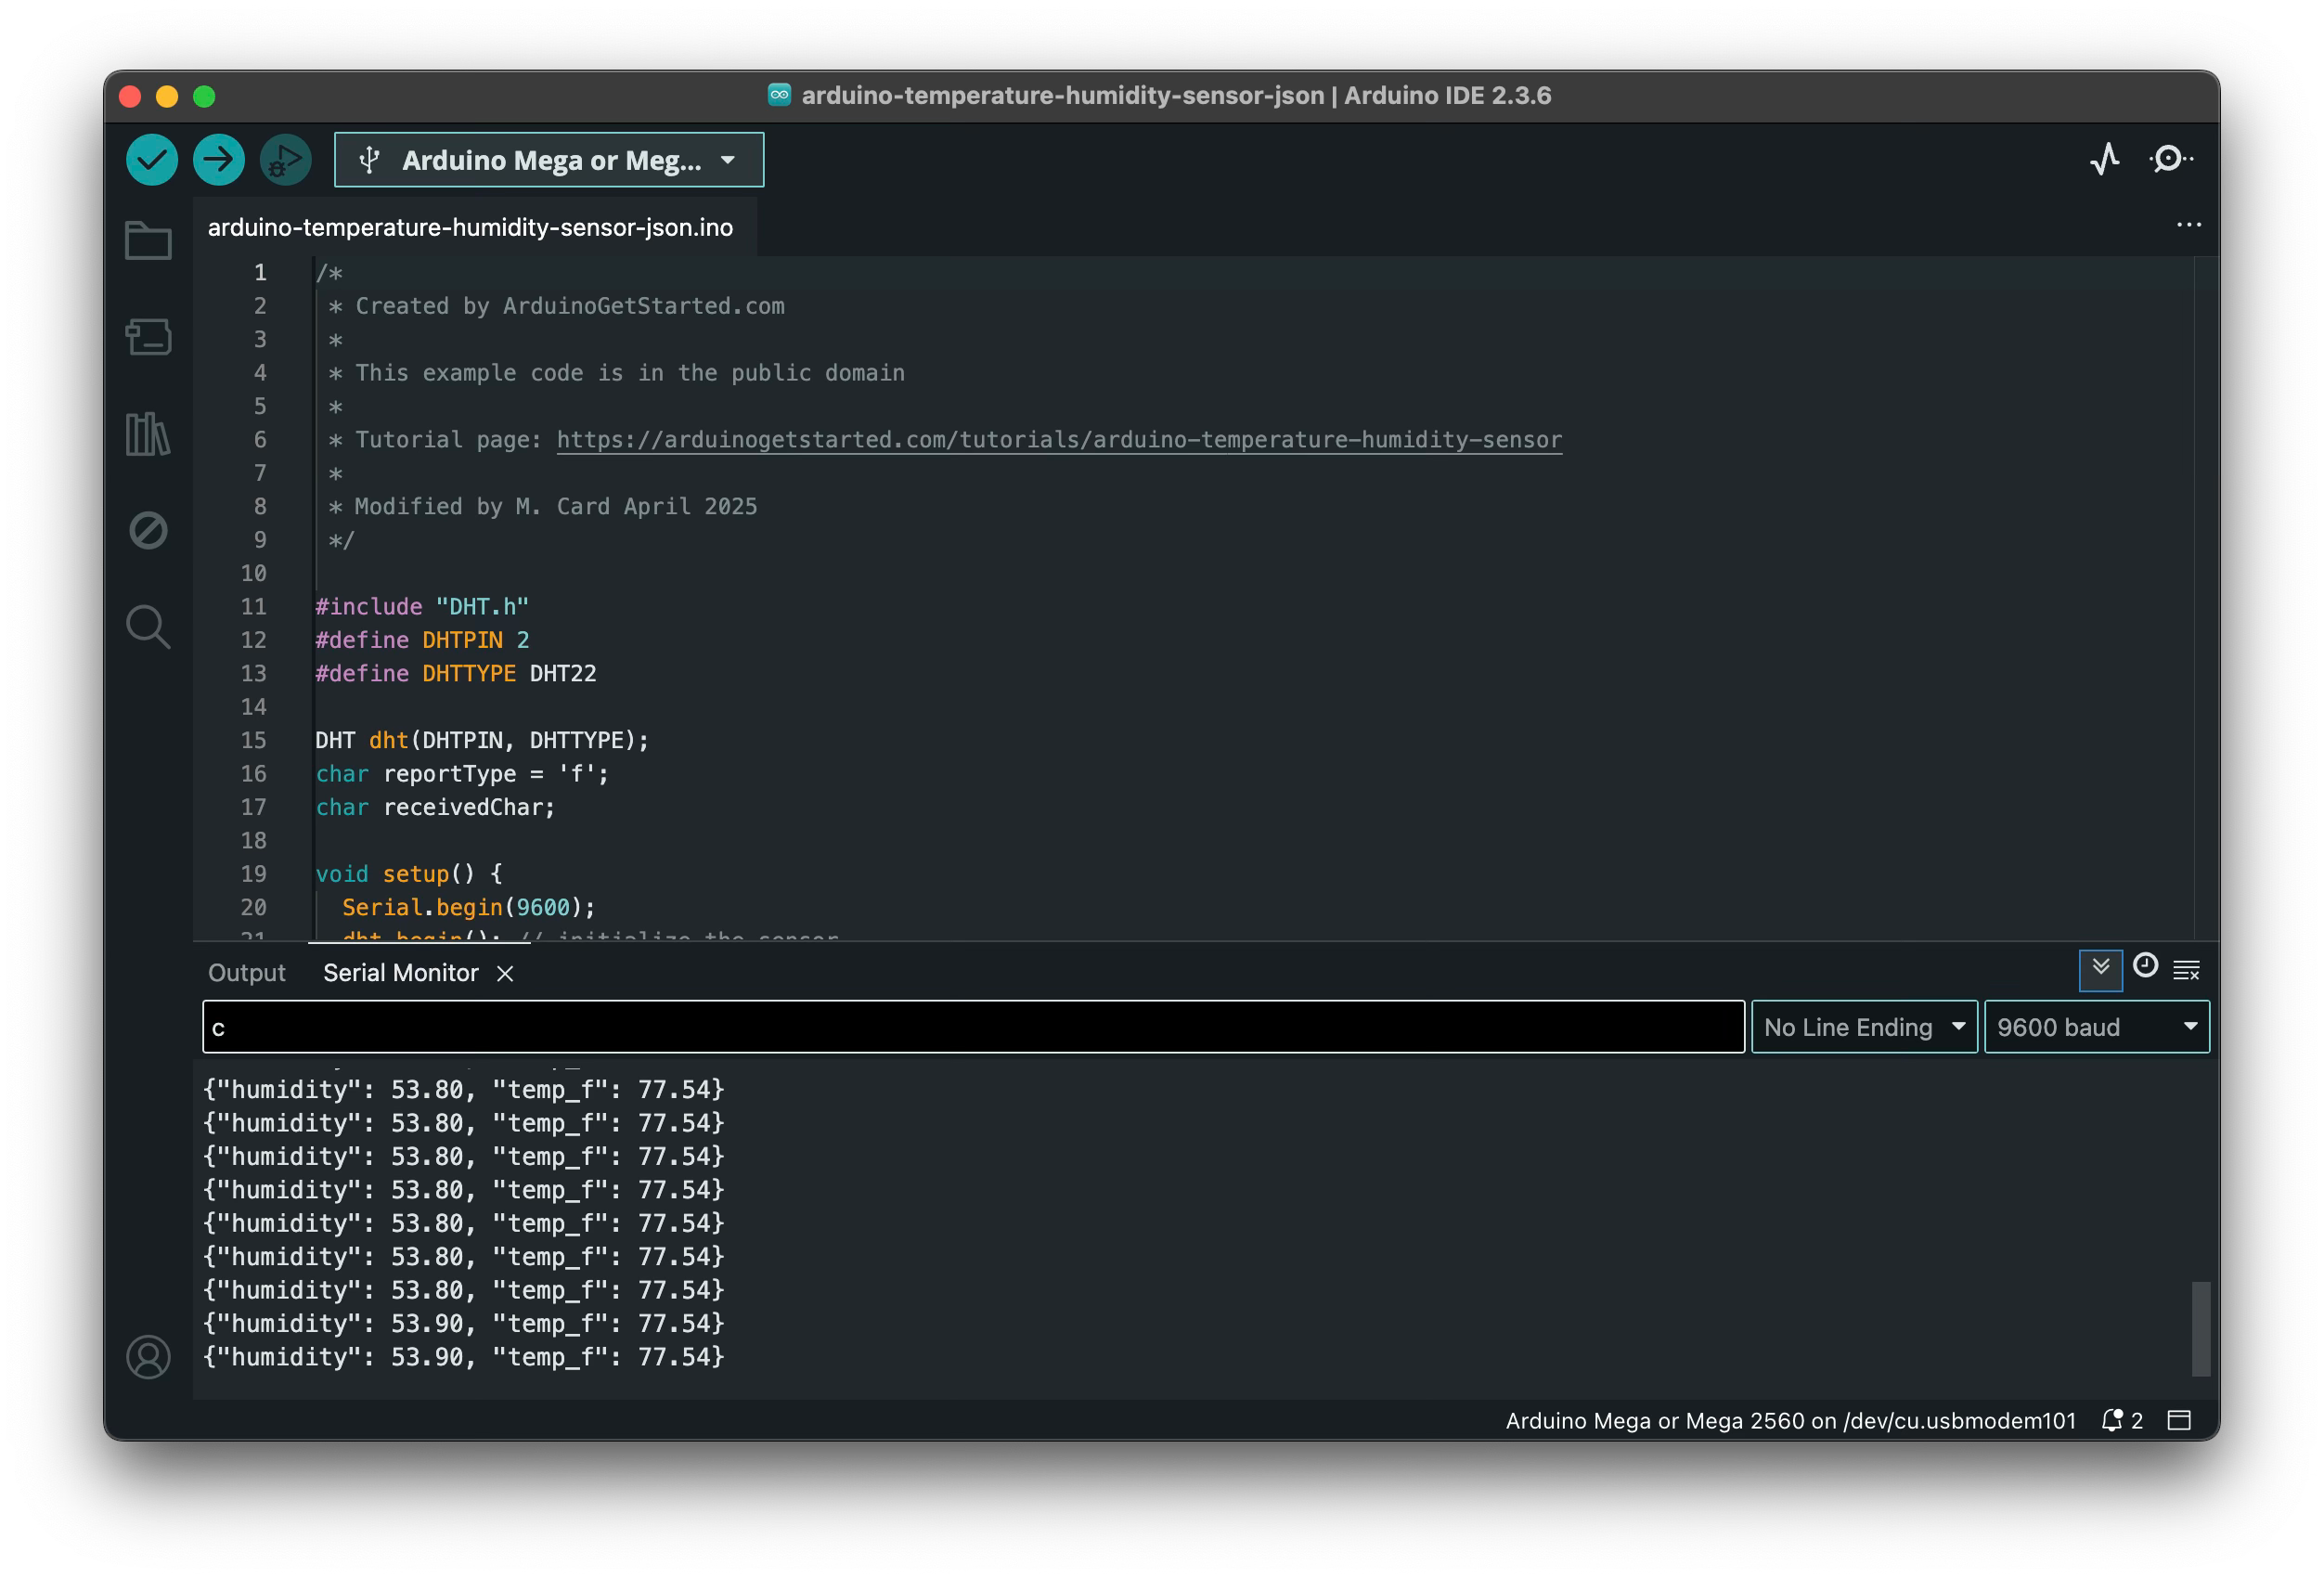
Now to see what the Arduino program is doing you can click the magnifying glass icon in the upper right corner of the window, this is the “serial monitor.” It displays whatever data the program is making available on the serial port like this:
Note that the serial monitor also includes a place where you can enter a command for the sketch to read and act upon. In our case if we enter a “c” the temperature will switch to Celsius:
After pressing c, the temperature reported will be in degrees C as shown here:
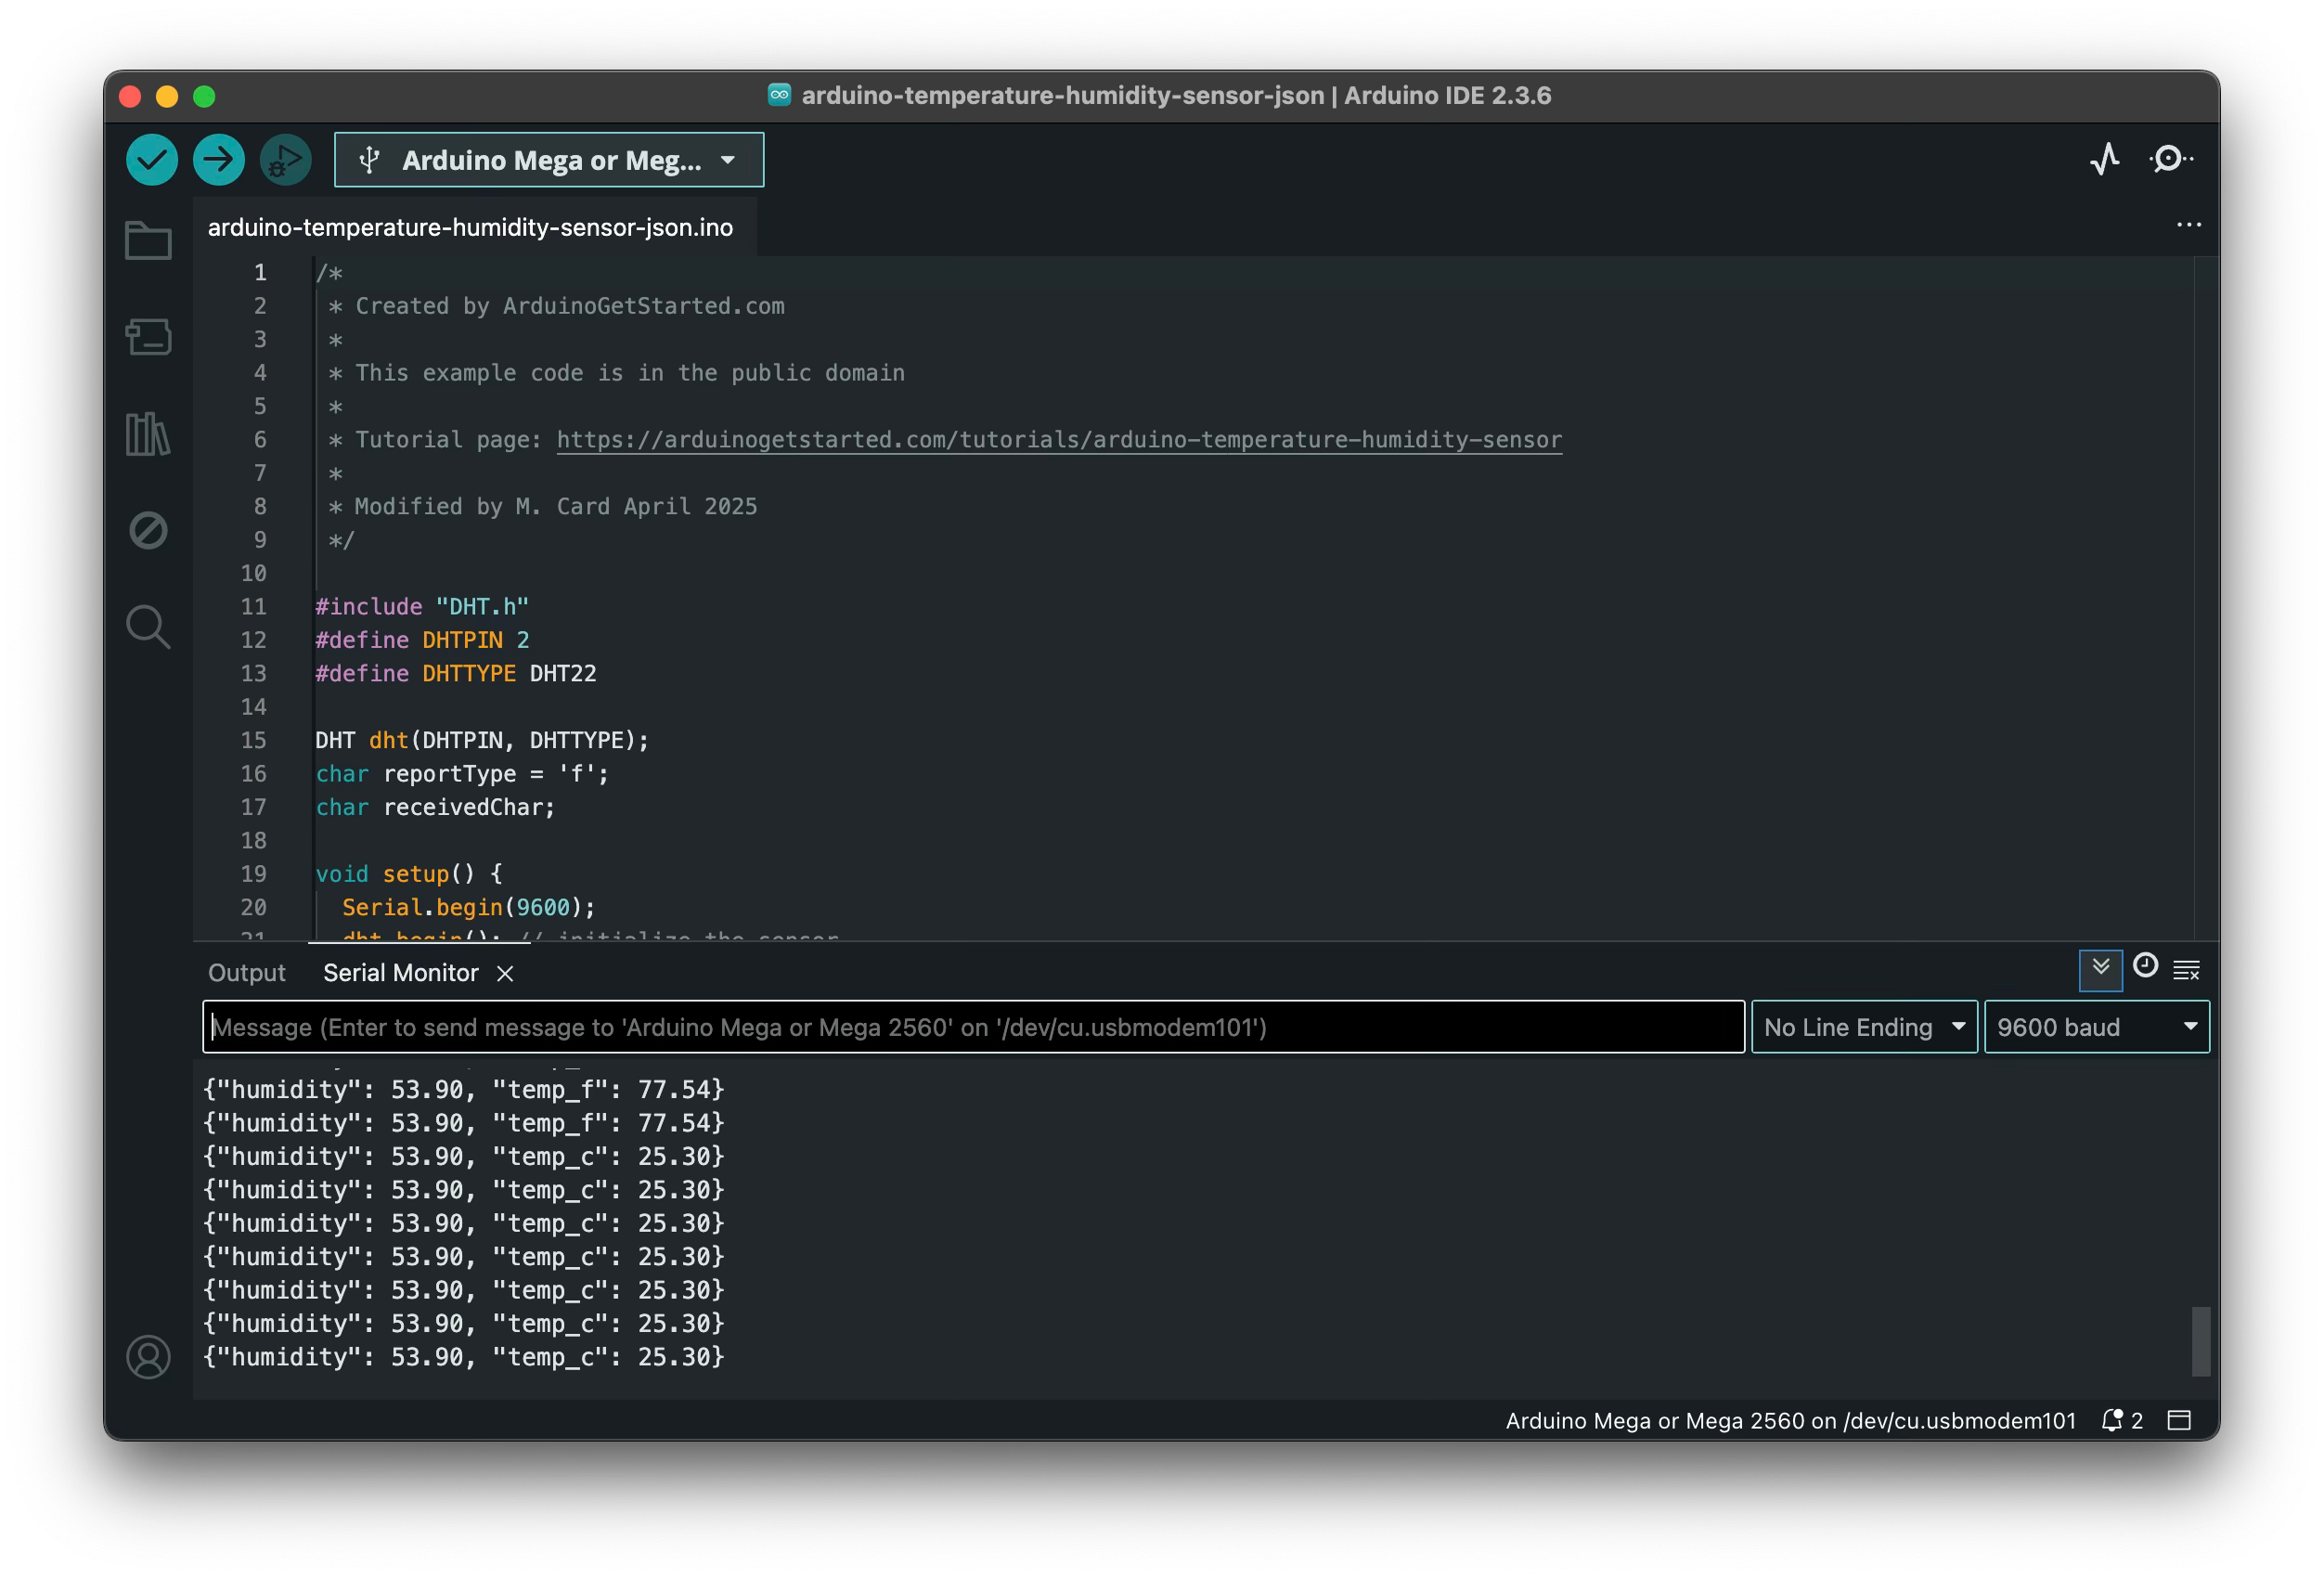
If you enter “f” for the command the sketch will again report temperature in Fahrenheit, and if you enter any command other than c or f only humidity will be reported.
When you have verified that the sketch is running correctly, remember to click the magnifying glass symbol again to turn off the serial monitor! If you do not do this the Python software will not be able to communicate over the serial port as it will be reported as busy.
So the Arduino sketch is reading the data from the sensor and making it available on the microcontroller’ serial port, now let’s see the Python program that is reading and writing to the serial port to access the sensor data:
BAUD_RATE = 9600
TIMEOUT_SEC = 2

# Set input to accept a keypress without blocking/requiring a return
fd = sys.stdin.fileno()
flags = fcntl.fcntl(fd, fcntl.F_GETFL)
fcntl.fcntl(fd, fcntl.F_SETFL, flags | os.O_NONBLOCK)


def read_serial_port(port: Serial) -> Dict[str, float]:
    """
    Read data from serial port and parse it as JSON.

    :param port: Serial port object.
    :return: Dictionary containing 'timestamp', 'humidity' and 'temperature' keys.
    """
    data = str(port.readline())
    first_open_brace = data.find("{")
    first_close_brace = data.find("}")
    if 0 <= first_open_brace < first_close_brace and first_close_brace >= 0:
        json_data = json.loads(data[first_open_brace : first_close_brace + 1])
        logger.info(f"Received JSON data: {json_data}")
        response = {}
        temp_data = json_data.get("temp_f", json_data.get("temp_c", None))
        humidity_data = json_data.get("humidity", None)
        if humidity_data:
            response["humidity"] = humidity_data
        if temp_data:
            response["temperature"] = temp_data
        return response
    else:
        logger.error("Received data is not in expected format")
        return {}
The first part of the Python code sets the standard input to be non-blocking and to accept a key press without requiring a return. This will make it easy for a user to press c or f to specify Celsius or Fahrenheit temperature readings from the Arduino board. The read_serial_port function reads the JSON-formatted string from the Arduino serial port buffer for data pin 2 and returns it as a dictionary object.
def collect_data(usb_port: str) -> List[Dict[str, float]]:
    """
    Collect data from the DHT sensor connected to the specified USB port.

    :param usb_port: USB port where the Arduino Uno board is connected.
    :return: List of dictionaries, each containing 'timestamp', 'humidity' and 'temperature' keys.

    """
    serial_port = Serial(
        port=usb_port,
        baudrate=BAUD_RATE,
        bytesize=serial.EIGHTBITS,
        parity=serial.PARITY_NONE,
        stopbits=serial.STOPBITS_ONE,
        timeout=TIMEOUT_SEC,
        xonxoff=False,
        rtscts=False,
    )

    data_points: List[Dict[str, float]] = []

    logger.info("Collecting data points at 1Hz until user presses Control-C")

    # read serial port until user presses Control-C
    try:
        while True:
            # non-blocking read of keyboard
            try:
                command = sys.stdin.read(2)
                if command:
                    if command == "f":
                        # Tell Arduino to report temperature in Farenheit
                        serial_port.write(b"f")
                        logger.info("User requested temperature data in Fahrenheit")
                    elif command == "c":
                        # Tell Arduino to report temperature in Celsius
                        serial_port.write(b"c")
                        logger.info("User requested temperature data in Celsius")
                    else:
                        logger.info(
                            f"User entered unknown command {command}, ignoring..."
                        )
            except BlockingIOError:
                pass  # Key not pressed

            data_point = read_serial_port(port=serial_port)
            if data_point:
                data_points.append(data_point)
                logger.info(f"Data point collected: {data_point}")
            time.sleep(1.0)
    except KeyboardInterrupt:
        logger.info("User interrupted data collection")
        serial_port.close()
        return data_points
The collect_data function reads the serial port buffer contents and parses them into JSON, adding each data point into the data_points list. This function also reads keyboard inputs, changing the temperature data to the desired temperature scale when c or f are pressed. It will collect data until control-C is pressed, in which case it will return the list of data points it has collected so far. The same thing happens if you are running in PyCharm and the user clicks the req square button to stop execution.
def plot_data(data_points: List[Dict[str, float]]) -> None:
    """
    Plot temperature and humidity data using plotly

    :param data_points: List of dictionaries, each containing 'timestamp', 'humidity' and 'temperature' keys.
    """

    humidity_data = [data_point["humidity"] for data_point in data_points]
    temperature_data = [data_point["temperature"] for data_point in data_points]
    index_data = [i for i in range(len(data_points))]

    # Create a plot with 2 subplots
    fig = make_subplots(specs=[[{"secondary_y": True}]])

    # Add traces to the plot
    fig.add_trace(
        go.Line(x=index_data, y=humidity_data, name="Humidity (%)"), secondary_y=True
    )
    fig.add_trace(
        go.Line(x=index_data, y=temperature_data, name="Temperature"), secondary_y=False
    )

    # Add labels
    fig.update_layout(
        title_text="Arduino Temperature and Humidity Data",
        xaxis_title="Index (data point #)",
        yaxis_title="Temperature",
        yaxis2_title="Humidity (%)",
    )

    fig.show()


def read_and_plot_data(
    usb_port: Annotated[
        str, typer.Argument(help="USB serial port name e.g. /dev/cu.usbmodem101")
    ],
) -> None:
    """
    Read data from the DHT sensor connected to the specified USB port,
    collect data until control-C is pressed, and then plot the data using plotly.

    :param usb_port: USB port where the Arduino board is connected.
    """
    data_points = collect_data(usb_port=usb_port)
    plot_data(data_points=data_points)
After data collection stops and the collect_data function returns a list of the points it has collected, this list is plotted in the web browser using plotly by the plot_data function. Plotly will plot your data in a page you can view from your browser. The read_and_plot_data function calls both collect_data to get the data and plot_dara to plot it.
# run main Arduino function
if __name__ == "__main__":
    typer.run(read_and_plot_data)
Finally, when running this script all you have to do is call the read_and_plot_data function. Here is what it looks like when you run this script inside PyCharm Community Edition:
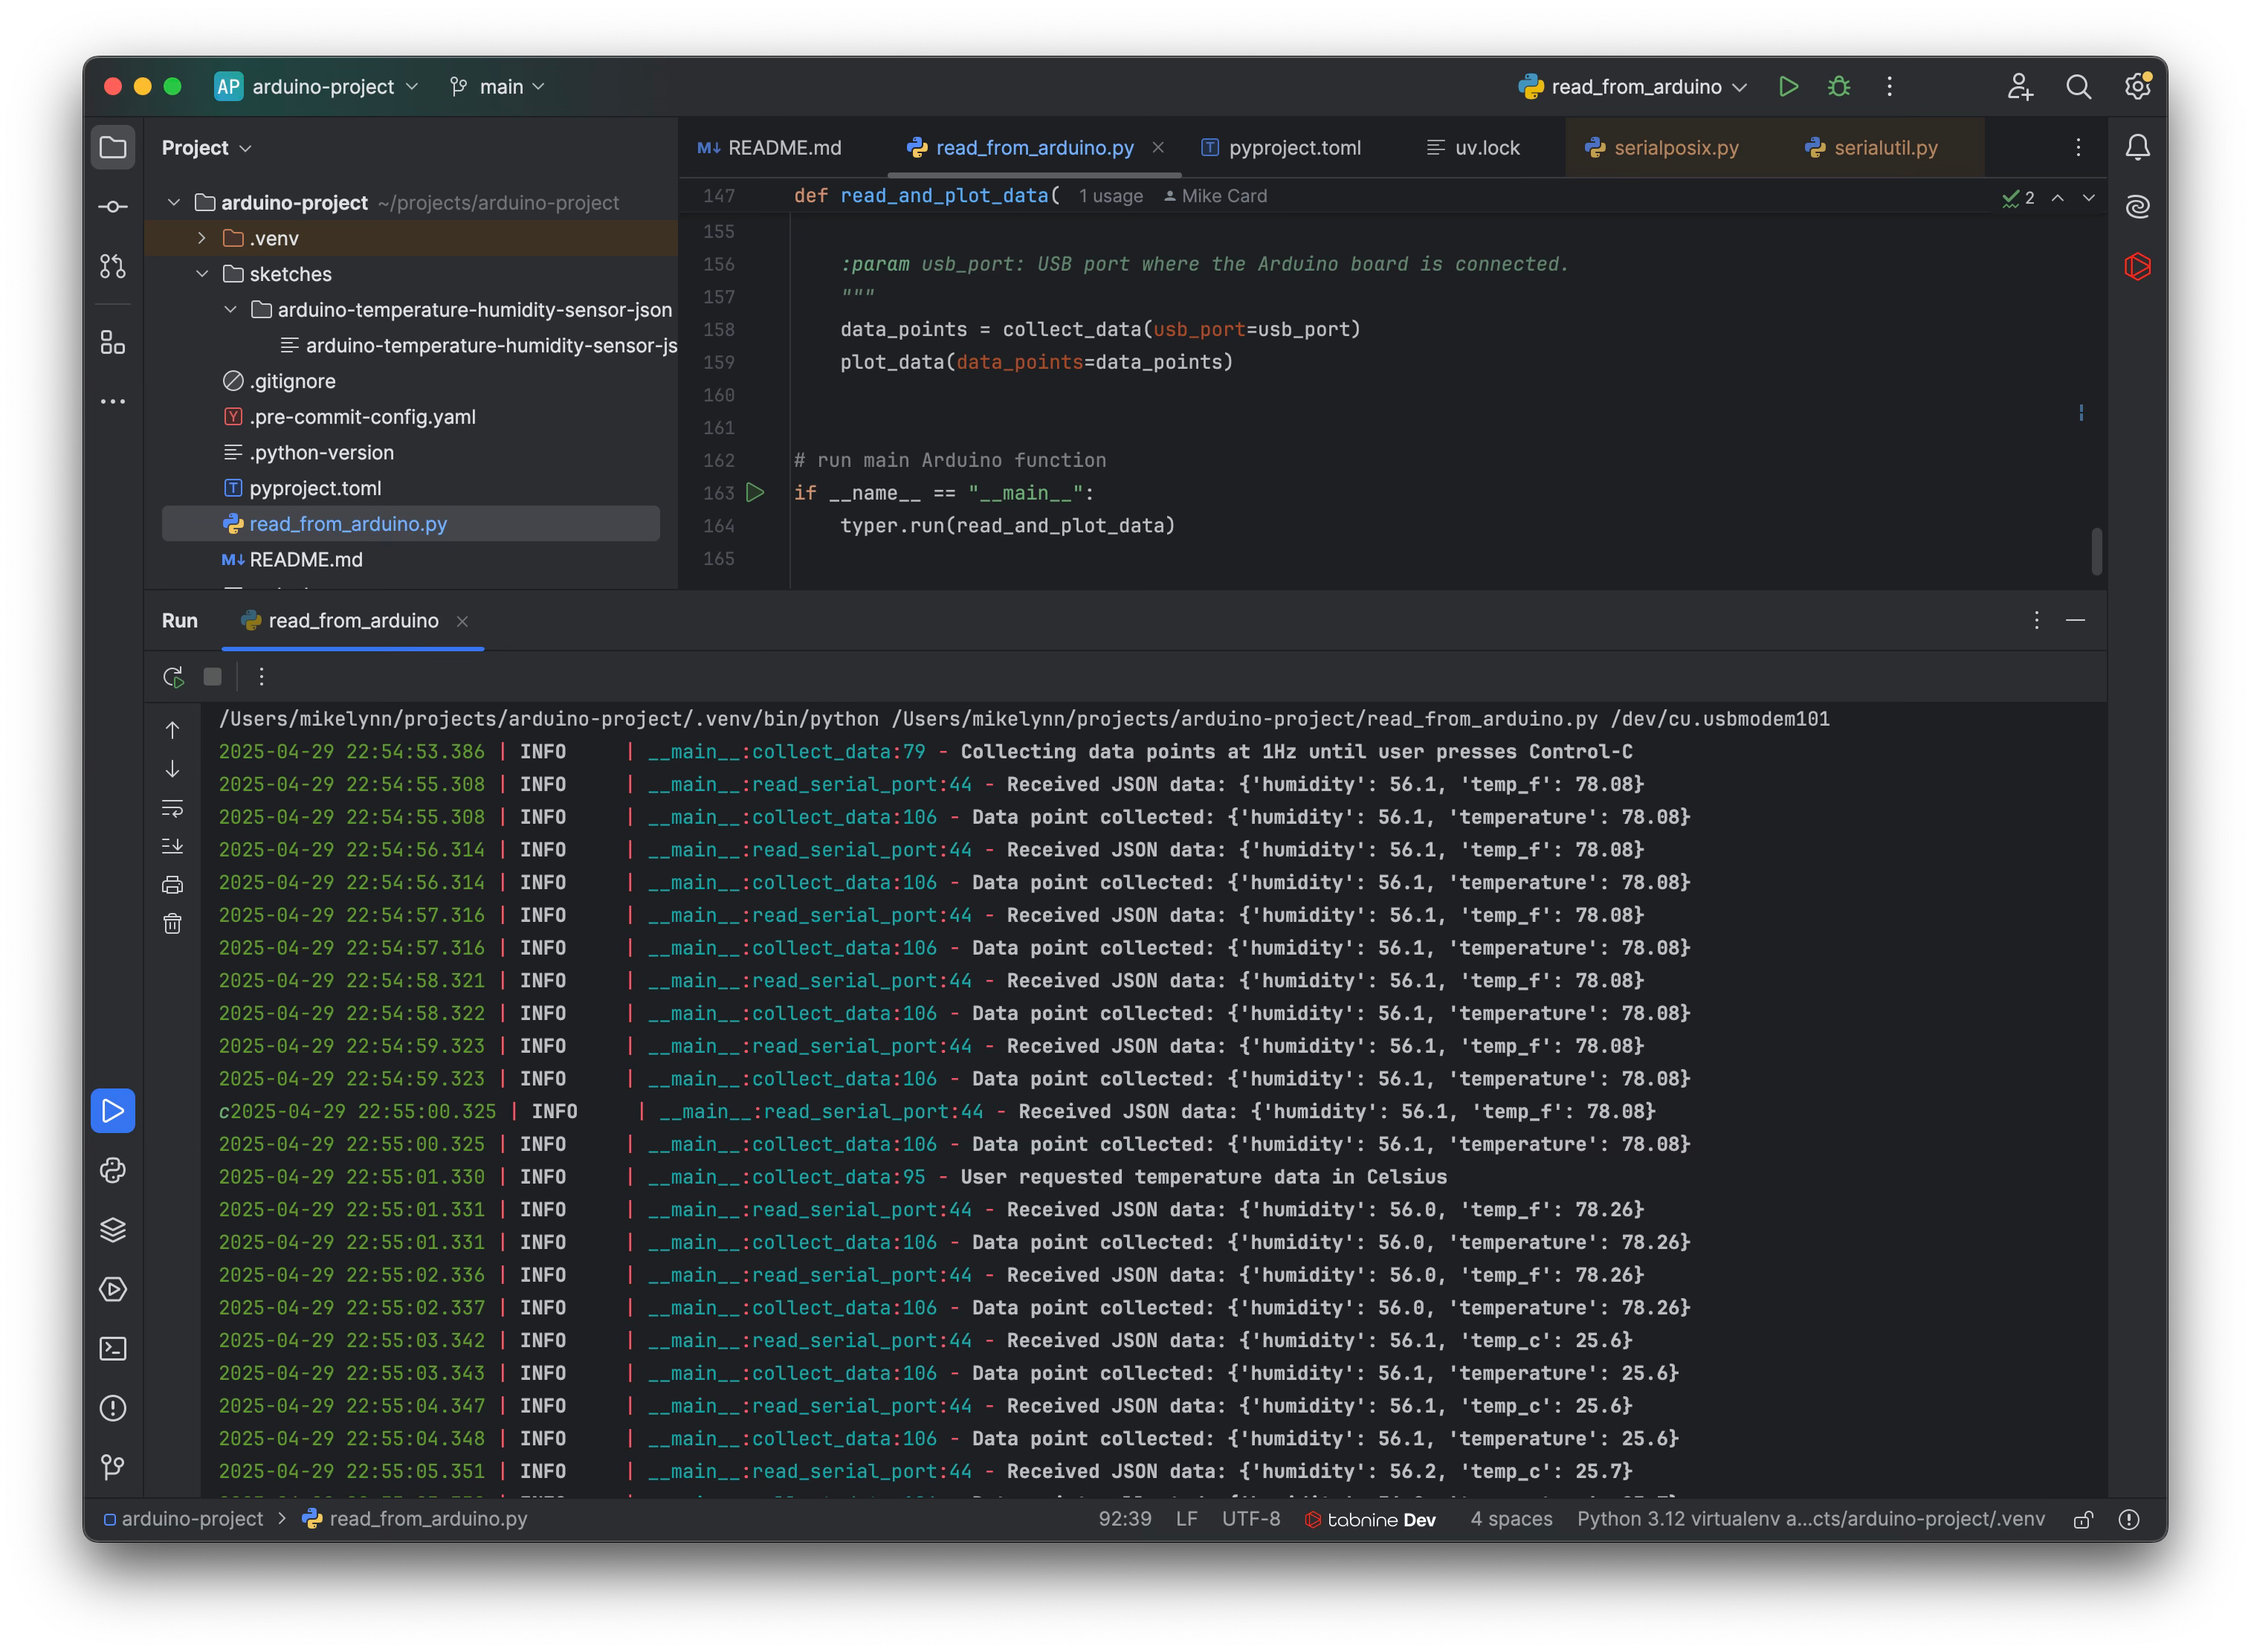
Notice here that I pressed c to briefly switch to Celsius temperature readings and pressed f shortly after to switch back. After pressing the red square in Pycharm to halt the data collection (akin to pressing control-C), the script stops collecting data and sends the data it has to plotly which makes this two-axis plot:
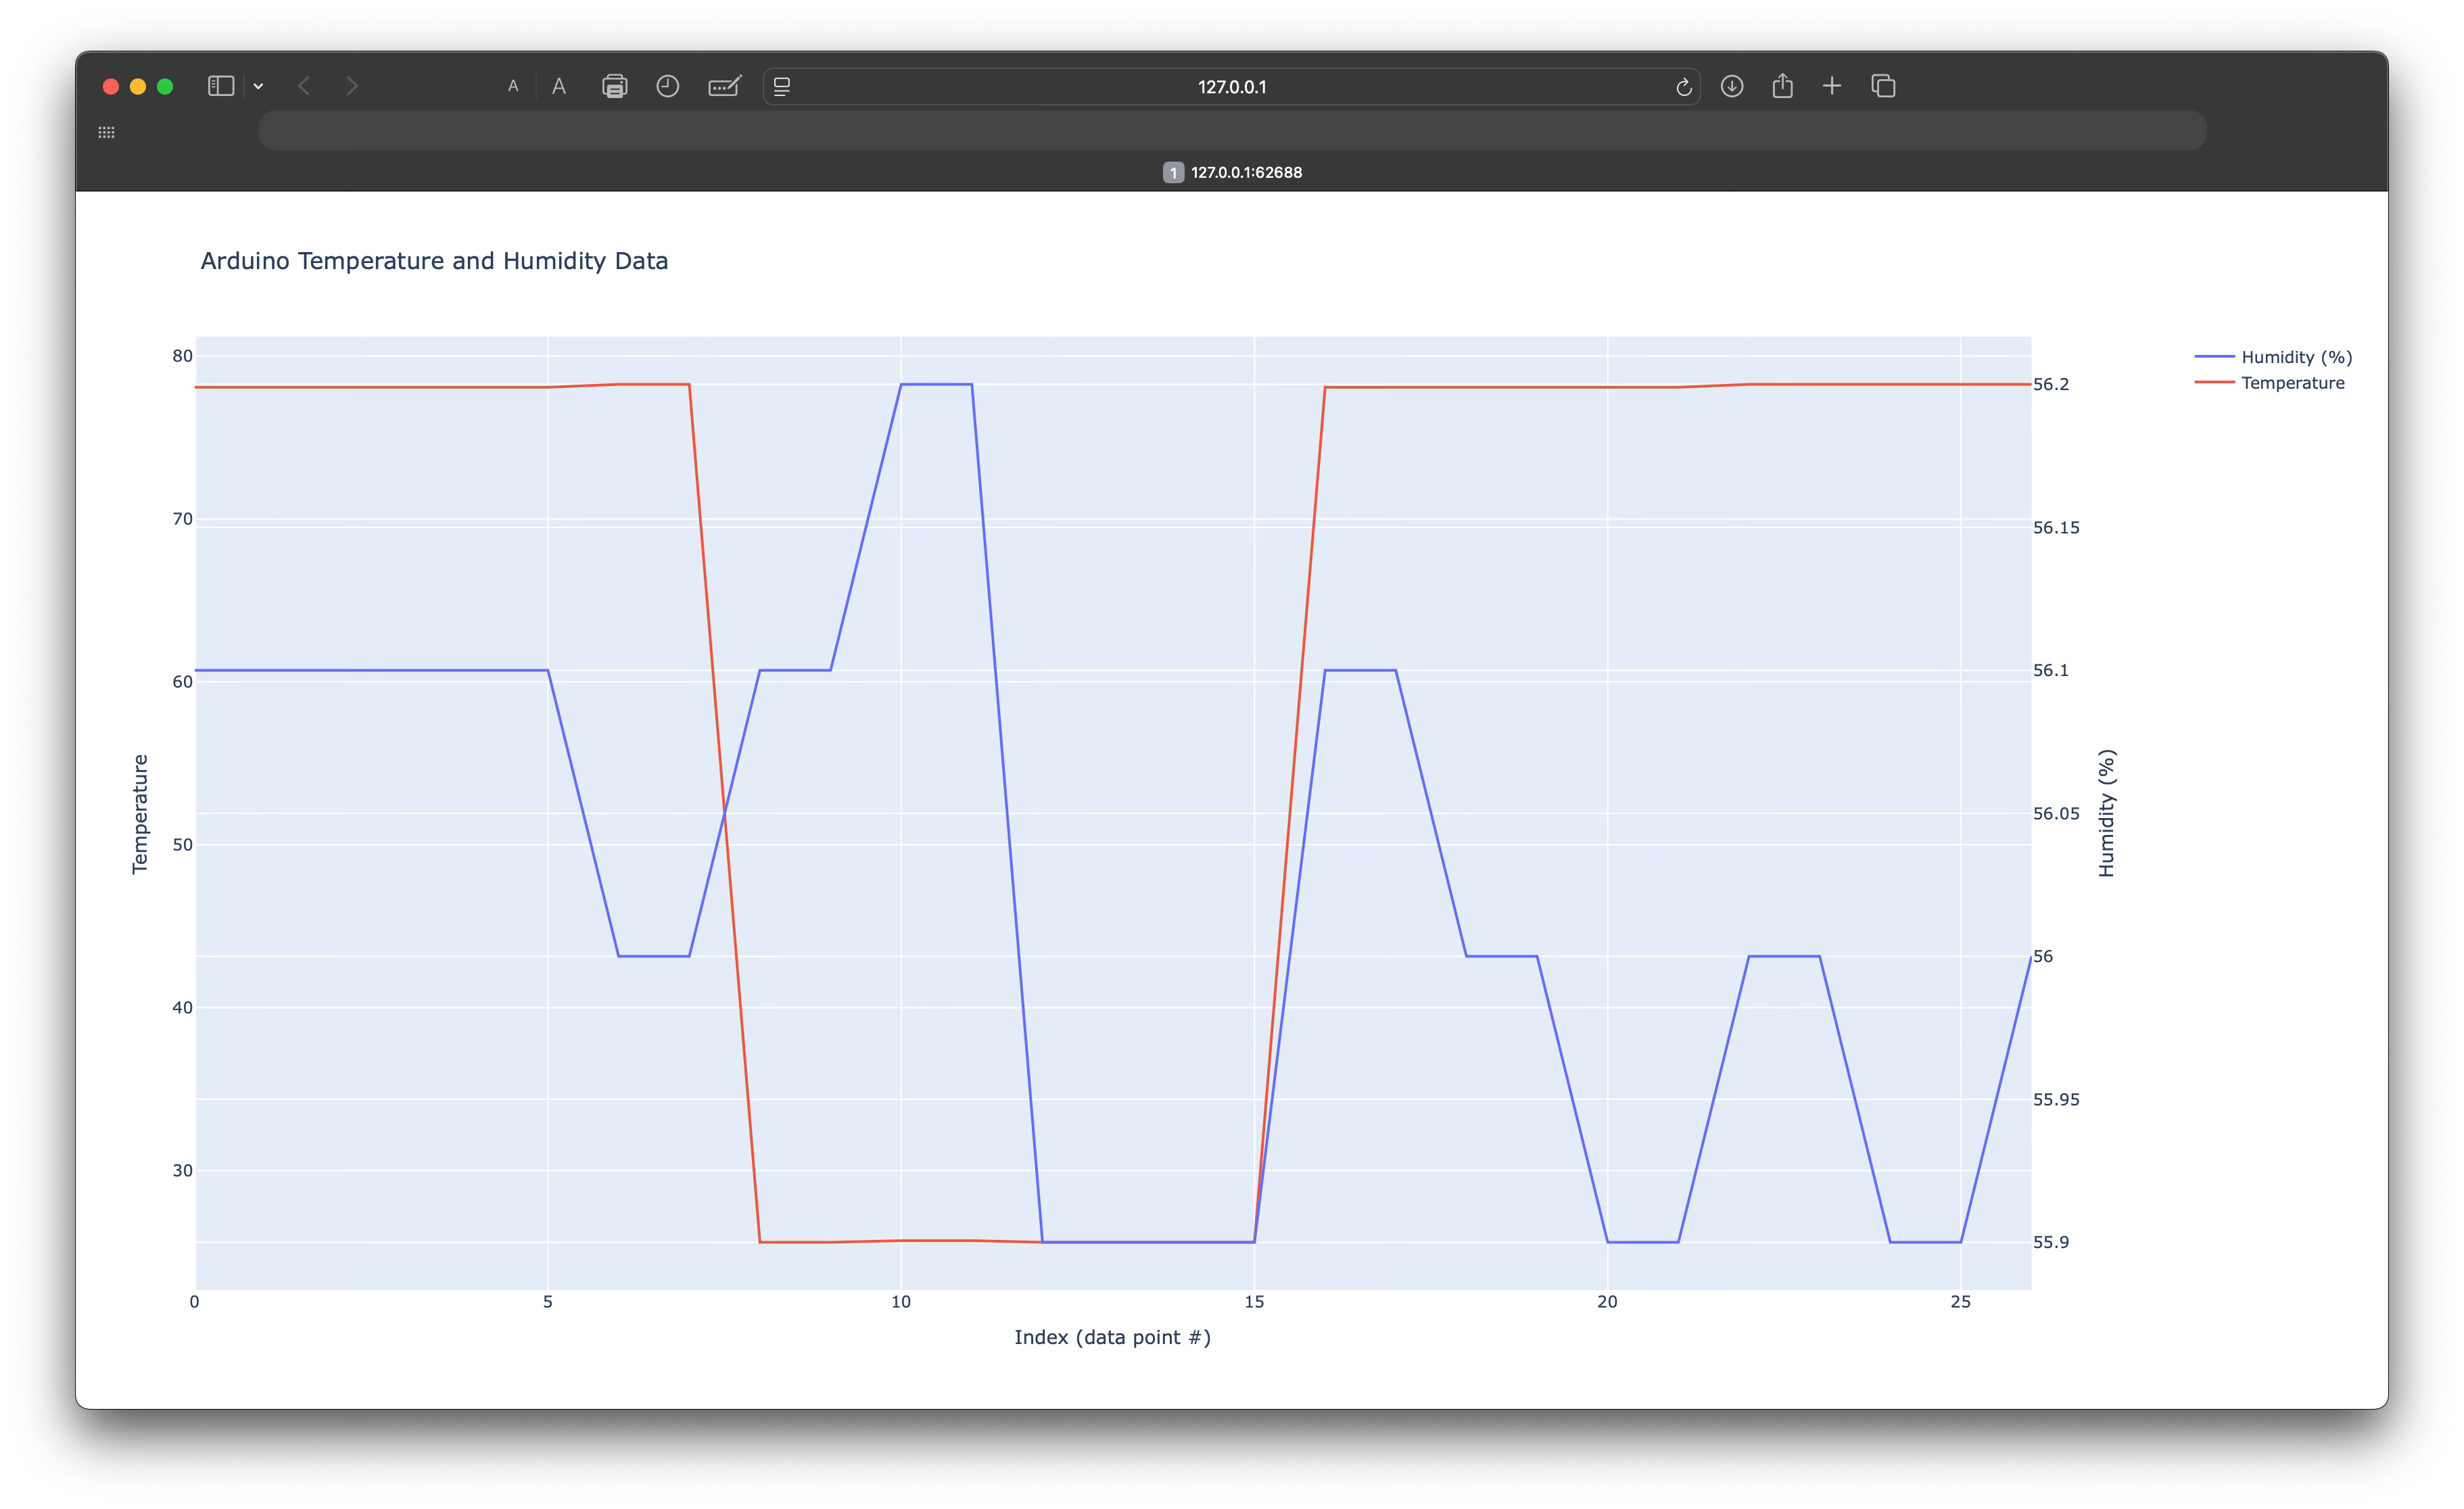
The temperature is shown in red with its Y-axis on the left and the humidity is shown in blue with its Y-axis on the right. Note the large drop in temperate that occurs when the temperature is switched from Fahrenheit to Celsius and back.
This shows you the basics of how to communicate with a program running on an Arduino microcontroller to collect sensor data via the microcontroller’s serial port and how you can plot the data you receive. We will expand upon this further in a future article.